Looker Studio is still free, and it still has a new name. On April 16, 2026 Google rebranded it back to Data Studio, the name it carried before 2022 (Data Studio release notes). Same product, same reports, and most people still search for the old name, so this guide uses both.
Teams rarely leave because of the price. They leave when reports hit the ceiling: blends that stop at five tables, Google Analytics 4 charts that fail on quota errors, connectors that cost extra for every non-Google source, and reports that belong to whoever built them. We read Google’s own documentation for each of those limits, then read the pricing pages of eight alternatives on November 3, 2026 and priced every one for the same 15-person marketing team. For the wider category, see our guide to marketing dashboard software.
TLDR
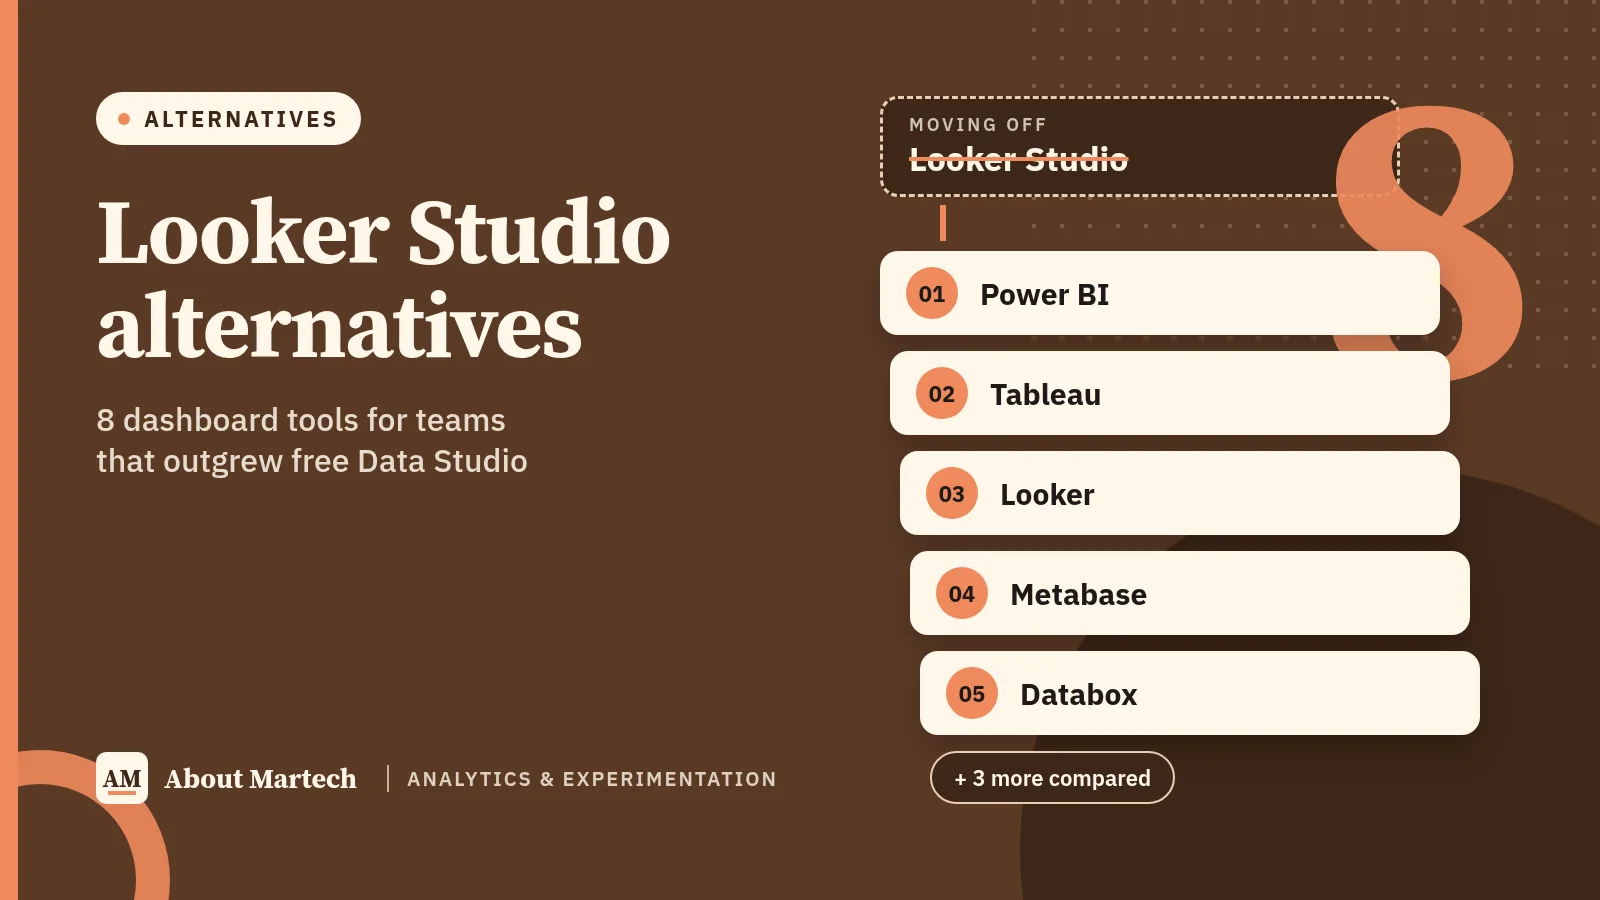
Short answer: If your team lives in Microsoft 365, Power BI is the best Looker Studio alternative for most in-house marketing teams: $14 per user a month, with far stronger data modelling. Pick Tableau for analyst-heavy teams, Looker for a governed semantic layer on BigQuery, and Metabase if you have a database and want a free, open-source option. Klipfolio, Databox, AgencyAnalytics and DashThis are easier marketing dashboards that need no data team. Before you switch, check whether Data Studio Pro at $9 per user per project fixes your actual problem.
- Name change: Looker Studio has been called Data Studio since April 16, 2026. It is still free; Data Studio Pro costs $9 per user per project a month (Google Cloud).
- Cheapest upgrade: Data Studio Pro. People who only view reports need no Pro licence, so 3 builders cost $27 a month.
- For a 15-person team (3 builders, 12 viewers): Klipfolio $120, Metabase Cloud $160, Databox $199, Power BI $210 and Tableau $405 a month at list price.
- Free alternative: Metabase’s open-source edition, if you can host it and your data sits in a database.
- Not the same product: Looker is Google’s enterprise BI platform with a LookML semantic layer, sold by quote. It is not the paid version of Looker Studio.
In this guide
Looker Studio alternatives at a glance
| Tool | Best for | What you pay for | Entry price | Viewers |
|---|---|---|---|---|
| Data Studio (baseline) | Free reporting on Google data | Nothing; Pro per user per project | Free; Pro $9 per user per project | Free |
| Power BI | Microsoft 365 teams that need real data modelling | Per user | $14 per user (Pro, yearly) | Need Pro unless on Premium or F64+ capacity |
| Tableau | Analyst teams doing deep visual analysis | Per user, by role | Creator $75, Viewer $15 (yearly) | $15 each on Standard |
| Looker | Governed metrics on BigQuery and other warehouses | Platform plus users | Quote only | Viewer licences, quoted |
| Metabase | Teams with a database that want open source | Plan plus users | Free self-hosted; Cloud from $100 | Count as users |
| Databox | KPI tracking for small teams | Users, data sources, AI credits | Free; Team $199 (yearly) | Sharing on Team plan |
| Klipfolio | Unlimited users at a flat price | Dashboards | $120 (yearly) or $140 monthly | Unlimited users |
| AgencyAnalytics | Agencies and multi-brand teams | Clients | $20 per client (yearly) | Unlimited staff accounts |
| DashThis | Fast, simple marketing reports | Dashboards and sources | $44 (yearly) | Unlimited users |
Prices are list prices in US dollars per month, read on each vendor’s pricing page on November 3, 2026. “Yearly” means the monthly price when billed annually. Tableau’s per-role prices come from its online store (buy.tableau.com); its pricing page shows only the starting Viewer price.
Why teams outgrow Looker Studio: the documented limits
Every limit below comes from Google’s own documentation, not from a competitor’s sales page. If none of them affects you, you probably do not need to switch.
- Blends stop at five tables. A blend can join data from up to five data sources, and each blend lives inside the report where it was created. You cannot reuse a blend across reports, only copy the whole report (Google). Teams that join ad spend, CRM, web analytics and revenue data hit this quickly.
- GA4 reports run into API quotas. Data Studio charts that read Google Analytics 4 are subject to GA4 Data API quotas, and Google lists the errors you will see, such as “Exhausted concurrent requests quota” (Data Studio troubleshooting). A standard GA4 property gets 40,000 core tokens per hour, 200,000 per day, 14,000 per project per hour and 10 concurrent requests. GA4 360 gets ten times the tokens and 50 concurrent requests (GA4 Data API quotas). A busy dashboard with many charts and viewers can burn through that.
- Non-Google data needs connectors you often pay for. Data Studio connects to “more than 1,400 data sources”, but Google builds connectors mainly for its own products. Most of the rest come from more than 1,300 partner Community Connectors (Google Cloud), which are built by third parties and can carry their own subscription fee.
- Free reports belong to people, not the company. Ownership of team content, team workspaces and admin controls are Data Studio Pro features. Pro links content to a Google Cloud project so reports keep working when their creator leaves (About Data Studio Pro).
- No support on the free tier. Technical support comes through Google Cloud Customer Care, and it needs both a Data Studio Pro subscription and a Google Cloud support plan (Google).
Which alternative fixes which limit
| Your problem | Fix inside Google | Alternatives that solve it |
|---|---|---|
| More than 5 sources in one view, or reusable joins | Model the data in BigQuery first | Power BI, Tableau, Looker, Metabase (build a data model once and reuse it) |
| GA4 quota errors on busy dashboards | Export GA4 to BigQuery, extract data, use fewer charts | Tools that refresh stored data on a schedule: Klipfolio, Power BI imported data, Metabase on a warehouse |
| Paying for Meta, LinkedIn or TikTok connectors | Buy partner connectors | AgencyAnalytics (90+ integrations), Klipfolio (130+), DashThis (30+), Databox |
| Reports break when someone leaves | Data Studio Pro team workspaces | Any paid tool with org-owned workspaces |
| One shared definition of “revenue” or “MQL” | Looker semantic models | Looker (LookML), Power BI semantic models, Metabase models |
| Branded reports for clients or brands | Not built in | AgencyAnalytics (white-labeled portal), DashThis |
First, check whether Data Studio Pro is enough
Data Studio Pro is the paid version of the same product. It costs $9 per user per project a month on a self-service subscription, billed monthly for every licence you buy (Google Cloud, Pro subscription overview). Only people who create, edit or manage content in Pro workspaces need a licence. People who only view reports do not (Google).
What Pro adds, per Google (About Data Studio Pro):
- Organization-owned content linked to a Google Cloud project, with IAM permissions.
- Team workspaces with Manager, Content Manager and Contributor roles.
- Up to 200 delivery schedules per report, delivery to Google Chat, and alerts when a chart meets a condition.
- Personal report links, so colleagues can explore their own copy without editing yours.
- Customer-managed encryption keys, customer-managed storage and data residency.
- Gemini assistance and access to Google Cloud Customer Care (with a Cloud support plan).
If you already pay for Looker, check your entitlement first: eligible Looker customers get at least 1,000 complimentary Data Studio Pro licences (Google).
Pro is enough if your pain is ownership, sharing, scheduling or support. Pro is not enough if you need more than five sources in one view, a reusable data model, connectors without a separate bill, or GA4 dashboards that do not fail under load. Pro does not change the blend limit or the GA4 API quotas. For those, keep reading.
What each alternative costs for the same team
To compare like with like, we priced one scenario on every tool: a 15-person in-house marketing team where 3 people build reports and 12 only view them. We used list prices, the cheapest plan that covers the team, and no add-ons.
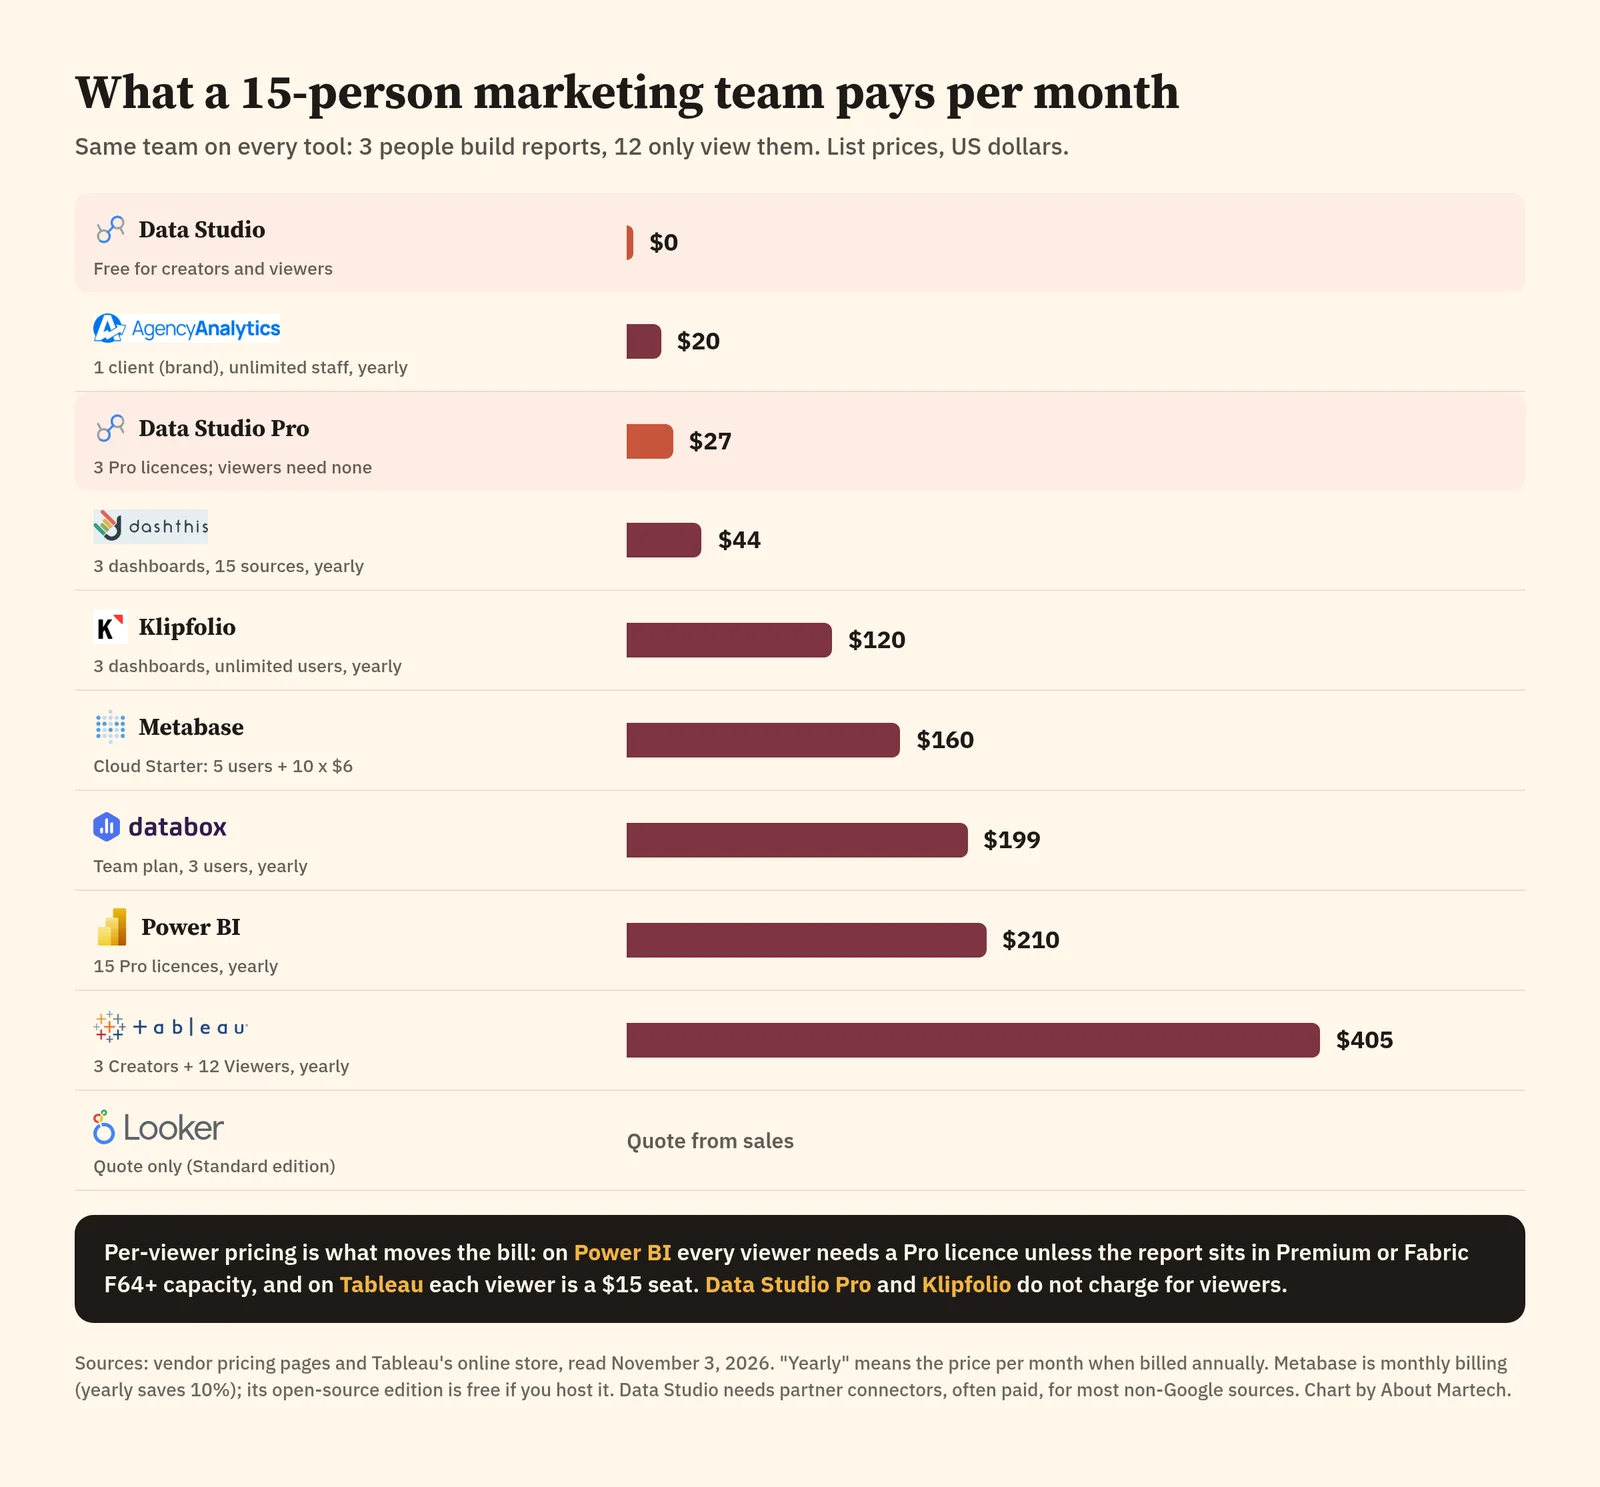
| Tool | Plan used | Monthly cost | How we got the number |
|---|---|---|---|
| Data Studio | Free | $0 | Free for creators and viewers; partner connectors extra |
| Data Studio Pro | Self-service | $27 | 3 licences x $9; viewers need no licence |
| AgencyAnalytics | Core plan, 1 client | $20 | $20 per client billed yearly, unlimited staff accounts |
| DashThis | Individual | $44 | 3 dashboards, 15 sources, unlimited users, billed yearly |
| Klipfolio | Base | $120 | Flat price, unlimited users, 3 dashboards, billed yearly ($140 monthly) |
| Metabase Cloud | Starter | $160 | $100 includes 5 users, plus 10 x $6; yearly billing saves 10% |
| Databox | Team | $199 | 3 users and 10 data sources, billed yearly |
| Power BI | Pro | $210 | 15 x $14; every viewer needs Pro outside Premium or F64+ capacity |
| Tableau Cloud | Standard | $405 | 3 Creators x $75 + 12 Viewers x $15, billed yearly |
| Looker | Standard edition | Quote | Annual contract through Google Cloud sales |
Two things the totals hide. First, the cheap marketing tools cap something else: Klipfolio Base and DashThis Individual allow 3 dashboards, Databox Team allows 10 data sources. Second, the BI tools need someone who can model data. Power BI and Tableau are cheap per seat but cost time to set up well.
The 8 best Looker Studio alternatives in 2026
1. Power BI: best for Microsoft 365 teams that need real data modelling
| Best for | Microsoft 365 teams that need real data modelling |
| Entry price | $14 per user a month (Pro, billed yearly); Premium Per User $24 |
| People who only view reports | Need a Pro licence, unless content sits in Premium or Fabric F64+ capacity |
| Data Studio limit it fixes | Five-table blends, reusable models, quota-bound live charts (you can import data) |
Power BI is Microsoft’s BI tool. You build reports in the free Power BI Desktop app, then publish them to the Power BI service to share. The free account lets you create reports for your own use, but you need Pro or Premium to share them (Power BI pricing).
The licensing detail that surprises Data Studio users: only Pro users can publish, share or consume other Pro users’ content, unless it sits in Premium capacity (Microsoft Learn). So in a shared workspace, your viewers need Pro too. On our 15-person team that is 15 x $14 = $210 a month. Premium Per User costs $24 per user and adds larger models and more frequent refreshes (Power BI pricing).
Where it beats Data Studio: A real data model. You can relate many tables once and reuse that model across reports, which removes the five-table blend ceiling, and importing data means charts do not query GA4 live on every view.
Where it falls short: Everyone who views a shared report needs a paid licence unless you buy capacity, and Power BI Desktop needs Windows 10 or later (Microsoft Learn), which matters for Mac-heavy marketing teams.
2. Tableau: best for analyst teams that do deep visual analysis
| Best for | Analyst teams that do deep visual analysis |
| Entry price | Creator $75, Explorer $42, Viewer $15 per user a month (Standard, billed yearly) |
| People who only view reports | $15 per Viewer on Standard; $35 on Enterprise |
| Data Studio limit it fixes | Five-table blends, reusable data sources, advanced visual analysis |
Tableau, owned by Salesforce, is the analyst’s choice for open-ended visual exploration. Tableau Cloud Standard prices by role: a Creator costs $75 a user a month, an Explorer $42 and a Viewer $15, all billed annually (Tableau online store). Every deployment needs at least one Creator, and there are no monthly plans (Tableau pricing).
Tableau Enterprise starts at $35 per user a month and adds Advanced Management and Data Management. A free Tableau Desktop edition lets you analyze Excel, CSV and database files locally, which is a low-risk way to test it (Tableau pricing).
Where it beats Data Studio: Far deeper visual analysis, Tableau Prep for cleaning data, and published data sources that every workbook can reuse.
Where it falls short: It is the most expensive per-seat option here ($405 a month for our team), it needs an annual contract, and it is more tool than most campaign dashboards need.
3. Looker: best for governed metrics on BigQuery and other warehouses
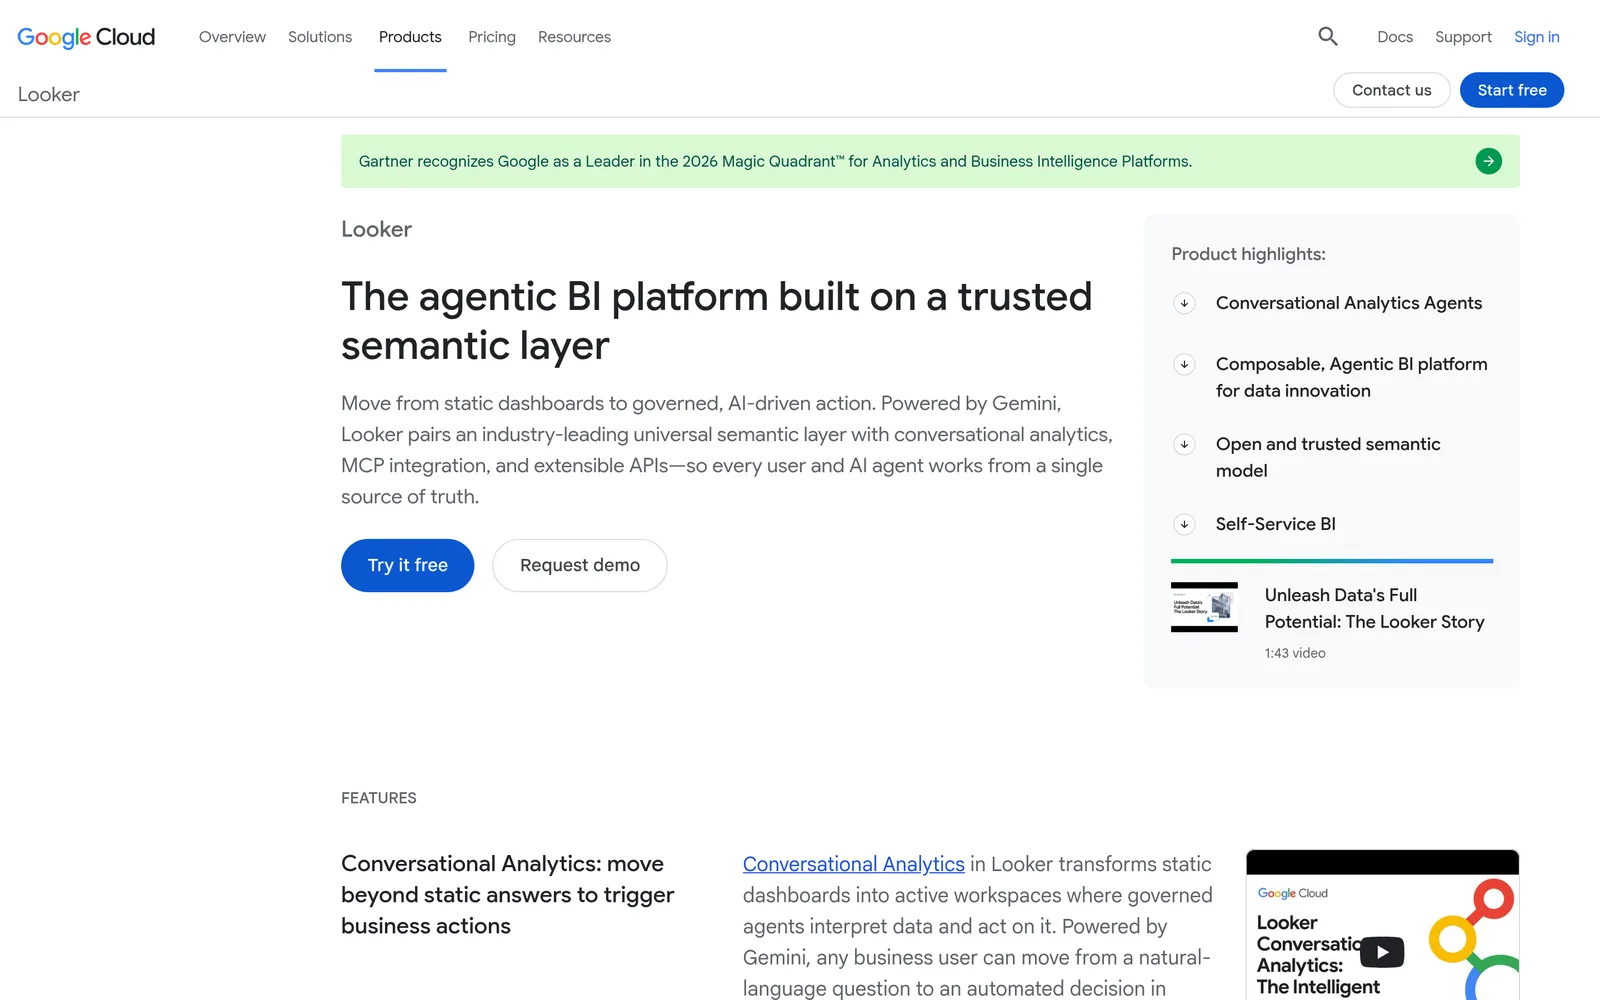
| Best for | Governed metrics on BigQuery and other warehouses |
| Entry price | Quote only, annual contract (Standard, Enterprise and Embed editions) |
| People who only view reports | Viewer licences, quoted with the platform |
| Data Studio limit it fixes | One shared definition of every metric, reusable models, warehouse-scale data |
Looker is the product people confuse with Looker Studio, and it is a different tool. Looker (Google Cloud core) is an enterprise BI platform built on LookML, a semantic layer where your data team defines metrics once for everyone (Looker pricing).
Pricing has a platform fee plus user licences, and every edition is “call sales”. The Standard edition targets teams of fewer than 50 users and includes 10 Standard users, 2 Developer users and up to 1,000 query-based API calls a month. Conversational Analytics is free within fair use until January 31, 2027; from February 1, 2027 usage beyond each instance’s monthly allowance costs $3 per million input tokens and $20 per million output tokens (Google Cloud).
Where it beats Data Studio: Governed metrics, so “revenue” means the same thing in every report. Data Studio can also connect to Looker (Google), so you can keep Data Studio as the front end.
Where it falls short: You need a data team that writes LookML, a warehouse, and a budget for an annual quote. For a marketing team without analysts it is overkill.
4. Metabase: best for teams with a database that want an open-source option
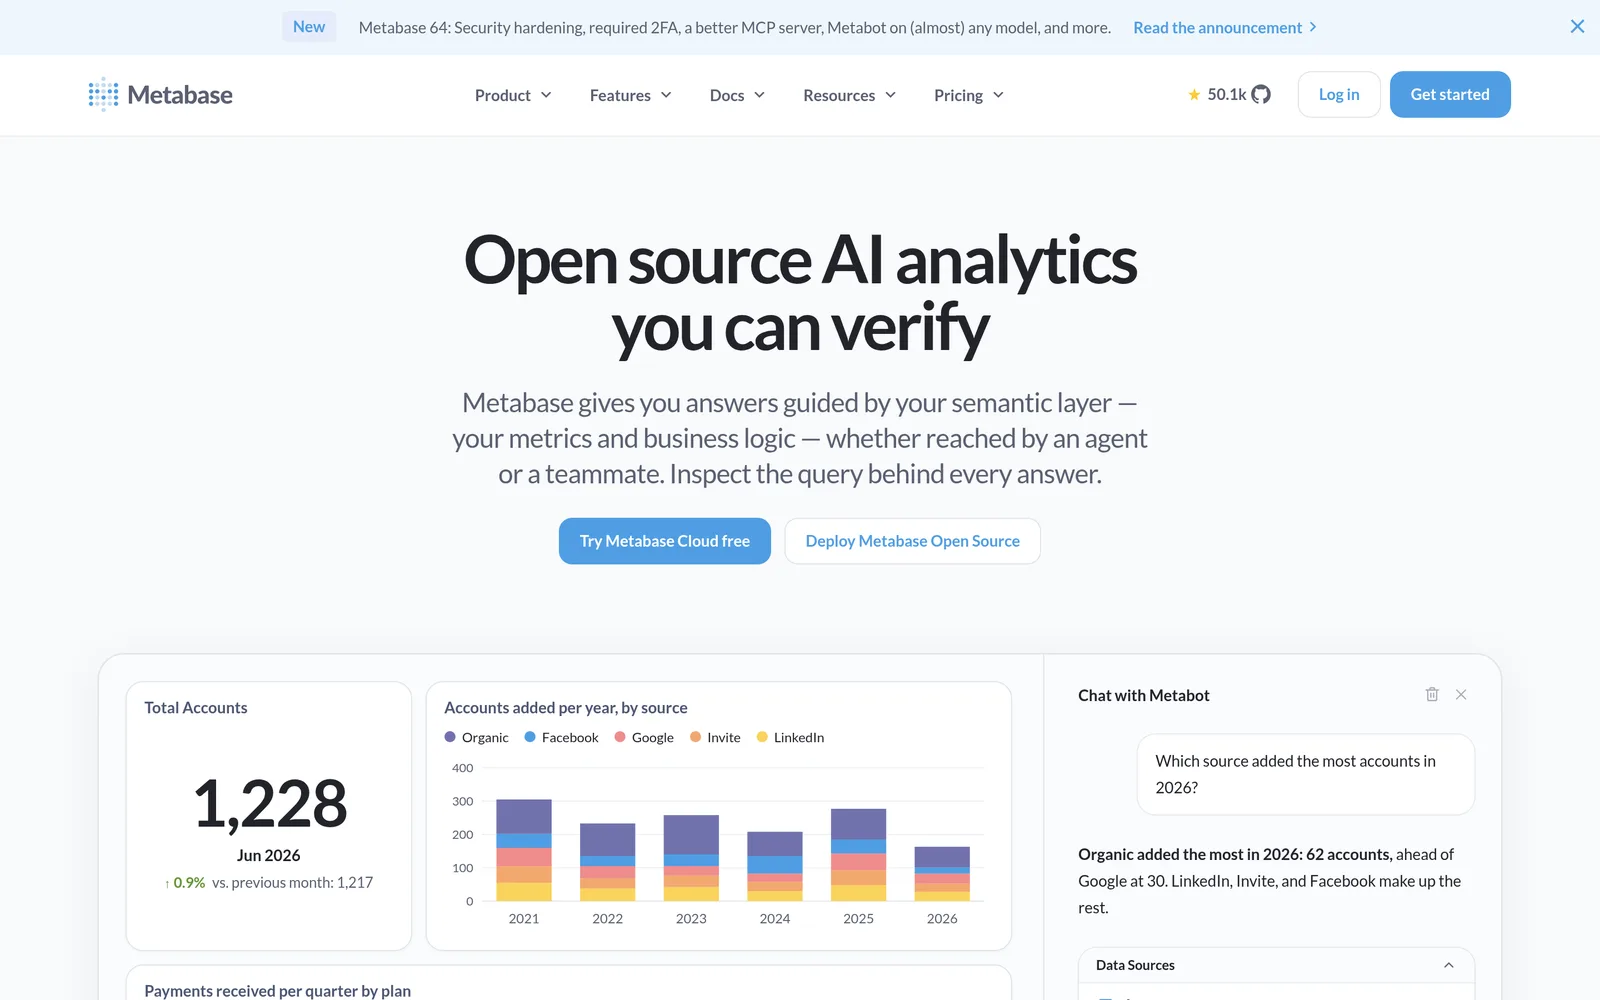
| Best for | Teams with a database that want an open-source option |
| Entry price | Free open-source edition (self-hosted); Cloud Starter $100 a month with 5 users |
| People who only view reports | Count as users: $6 each after 5 on Starter, $12 each after 10 on Pro |
| Data Studio limit it fixes | Reusable models and SQL on your own database, no connector bills |
Metabase is an open-source BI tool for querying a database by clicking or writing SQL. You can self-host the open-source edition for free. Metabase Cloud Starter costs $100 a month with the first 5 users included, then $6 per user. Pro costs $575 a month with 10 users included, then $12 per user, and adds row and column permissions, SSO and usage auditing. Yearly billing saves 10%, and there is a 14-day free trial (Metabase pricing).
Starter lists 20+ supported data sources, so Metabase fits teams whose marketing data already lands in a warehouse such as BigQuery or Postgres, not teams that want to plug in ad accounts directly.
Where it beats Data Studio: No per-connector bills and no API quotas when your data lives in your own database, plus a free self-hosted option.
Where it falls short: It has no native connectors for ad platforms. You need a pipeline to load marketing data first; see our guide to marketing ETL tools below.
5. Databox: best for KPI tracking for small in-house teams
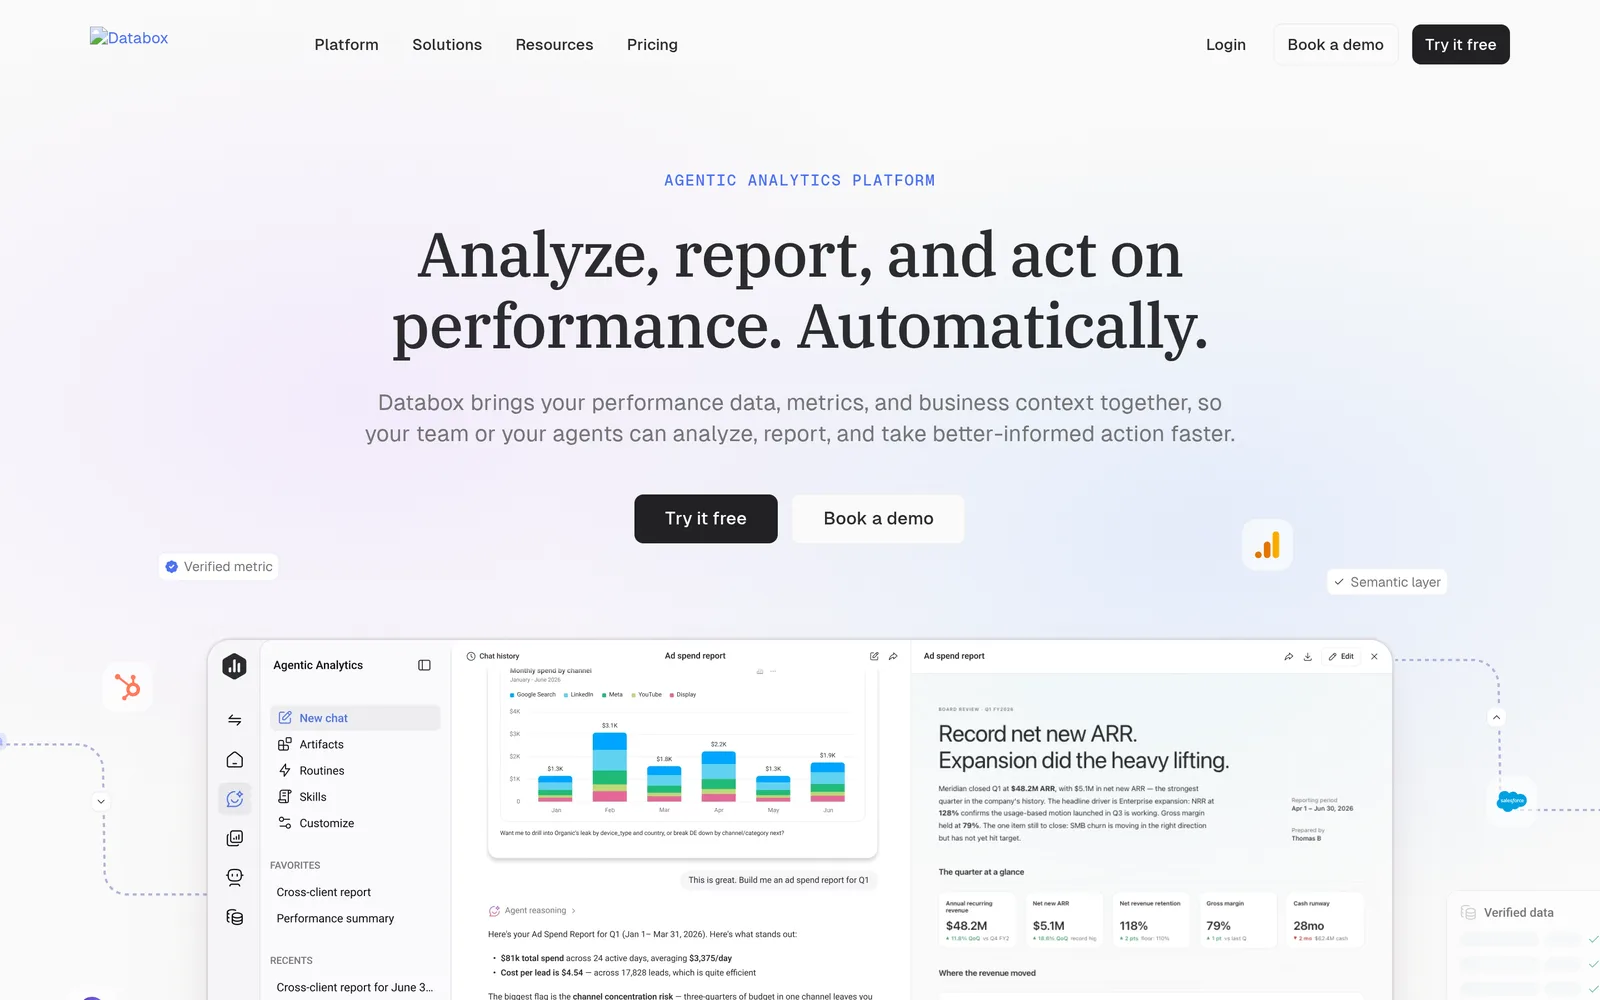
| Best for | KPI tracking for small in-house teams |
| Entry price | Free plan (1 user, 3 data sources); Analyst $71; Team $199 a month (billed yearly) |
| People who only view reports | Team plan includes 3 users plus sharing and notifications |
| Data Studio limit it fixes | Paid connectors (integrations are included in the plan) |
Databox is a KPI dashboard tool with built-in integrations and an AI analyst it calls Genie. The free plan includes 1 user, 3 data sources and 50 AI credits a month. Analyst costs $71 a month billed annually for 1 user and 5 data sources. Team costs $199 a month billed annually for 3 users, 10 data sources and 500 AI credits, with sharing and notifications. Annual billing saves 20% (Databox pricing).
An Agency plan starts at $99 a month with unlimited users and 20 data sources, plus account packs at $25 a month each (Databox).
Where it beats Data Studio: Integrations come with the plan, setup takes no data team, and an AI analyst can summarize performance for you.
Where it falls short: Data source limits are tight on the cheaper plans, and custom analysis is shallower than a BI tool.
6. Klipfolio: best for unlimited users at a flat monthly price
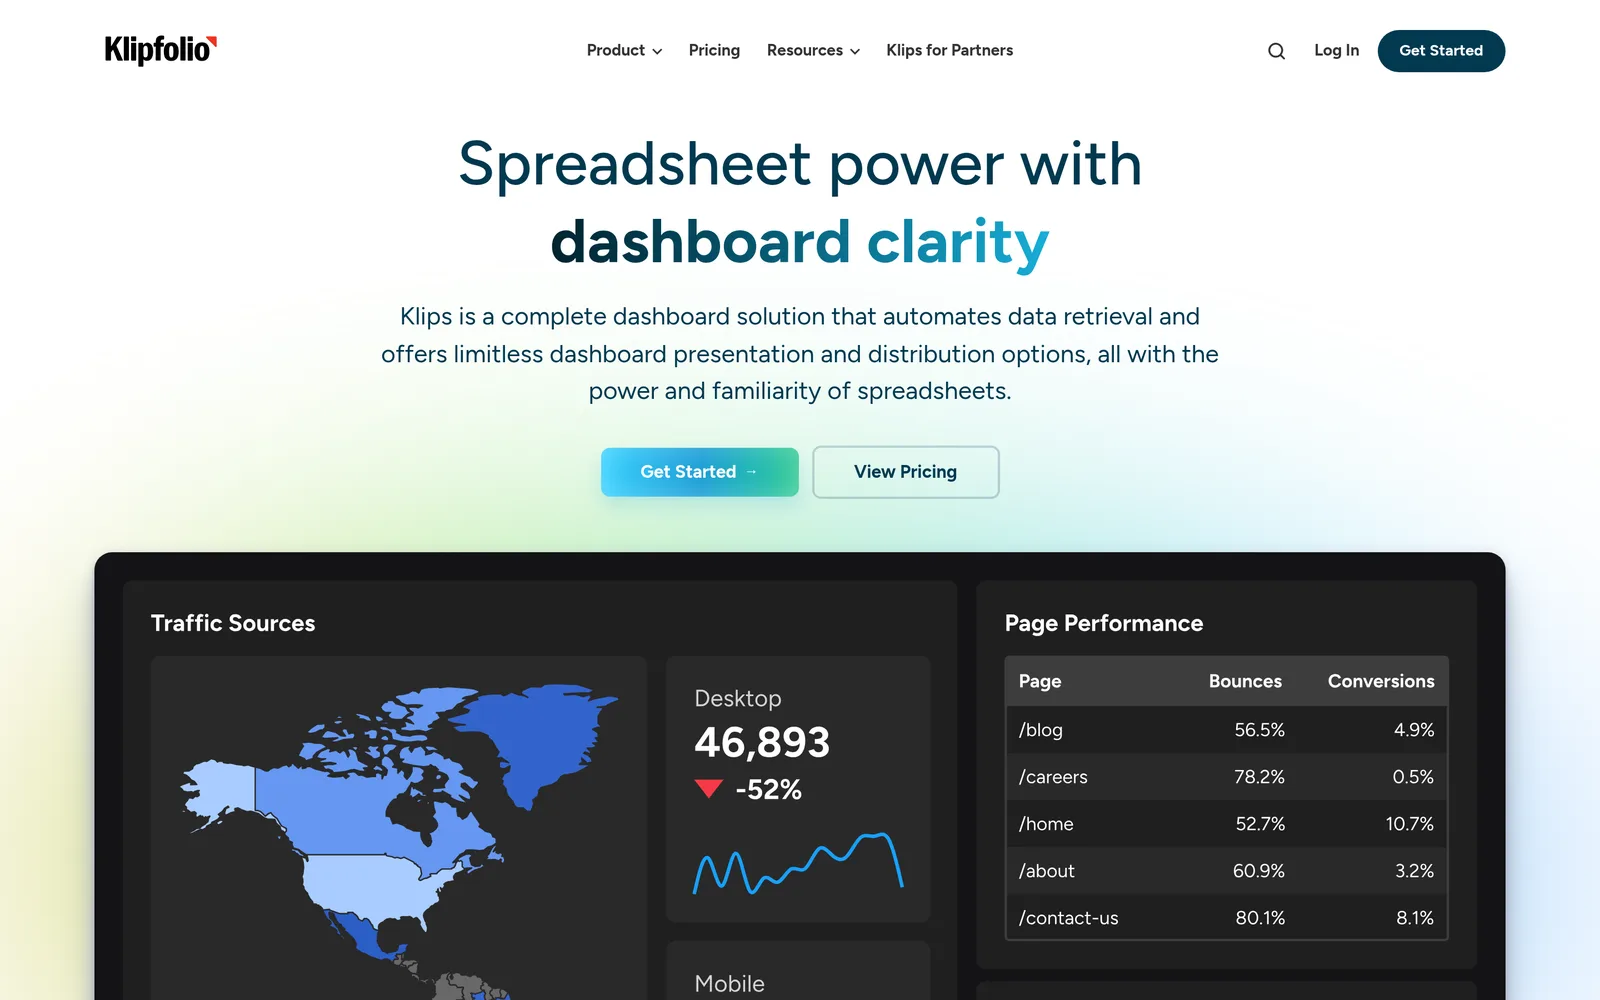
| Best for | Unlimited users at a flat monthly price |
| Entry price | Base $120 a month billed yearly ($140 monthly) for 3 dashboards |
| People who only view reports | Unlimited users on every plan |
| Data Studio limit it fixes | Paid connectors, viewer costs, joins (data modelling on every plan) |
Klipfolio prices by dashboards, not people. Base costs $120 a month billed annually ($140 monthly) for 3 dashboards and a 4-hour data refresh. Grow costs $190 ($220 monthly) for 10 dashboards with a 1-hour refresh, published links and scheduled reports. Team costs $310 ($350) for 20 dashboards and a 15-minute refresh with SSO. Every plan includes unlimited users and 130+ data integrations (Klipfolio pricing).
Data modelling and joins are on every plan, so you can combine sources inside Klipfolio instead of building Data Studio blends.
Where it beats Data Studio: A predictable bill no matter how many people view reports, plus faster refresh options on higher plans.
Where it falls short: Dashboard caps are low on Base, and published links and scheduled reports start on Grow ($190), not Base.
7. AgencyAnalytics: best for agencies and teams reporting on several brands
| Best for | Agencies and teams reporting on several brands |
| Entry price | $20 per client a month billed yearly |
| People who only view reports | Unlimited staff accounts |
| Data Studio limit it fixes | Paid connectors, branded reporting, client portal |
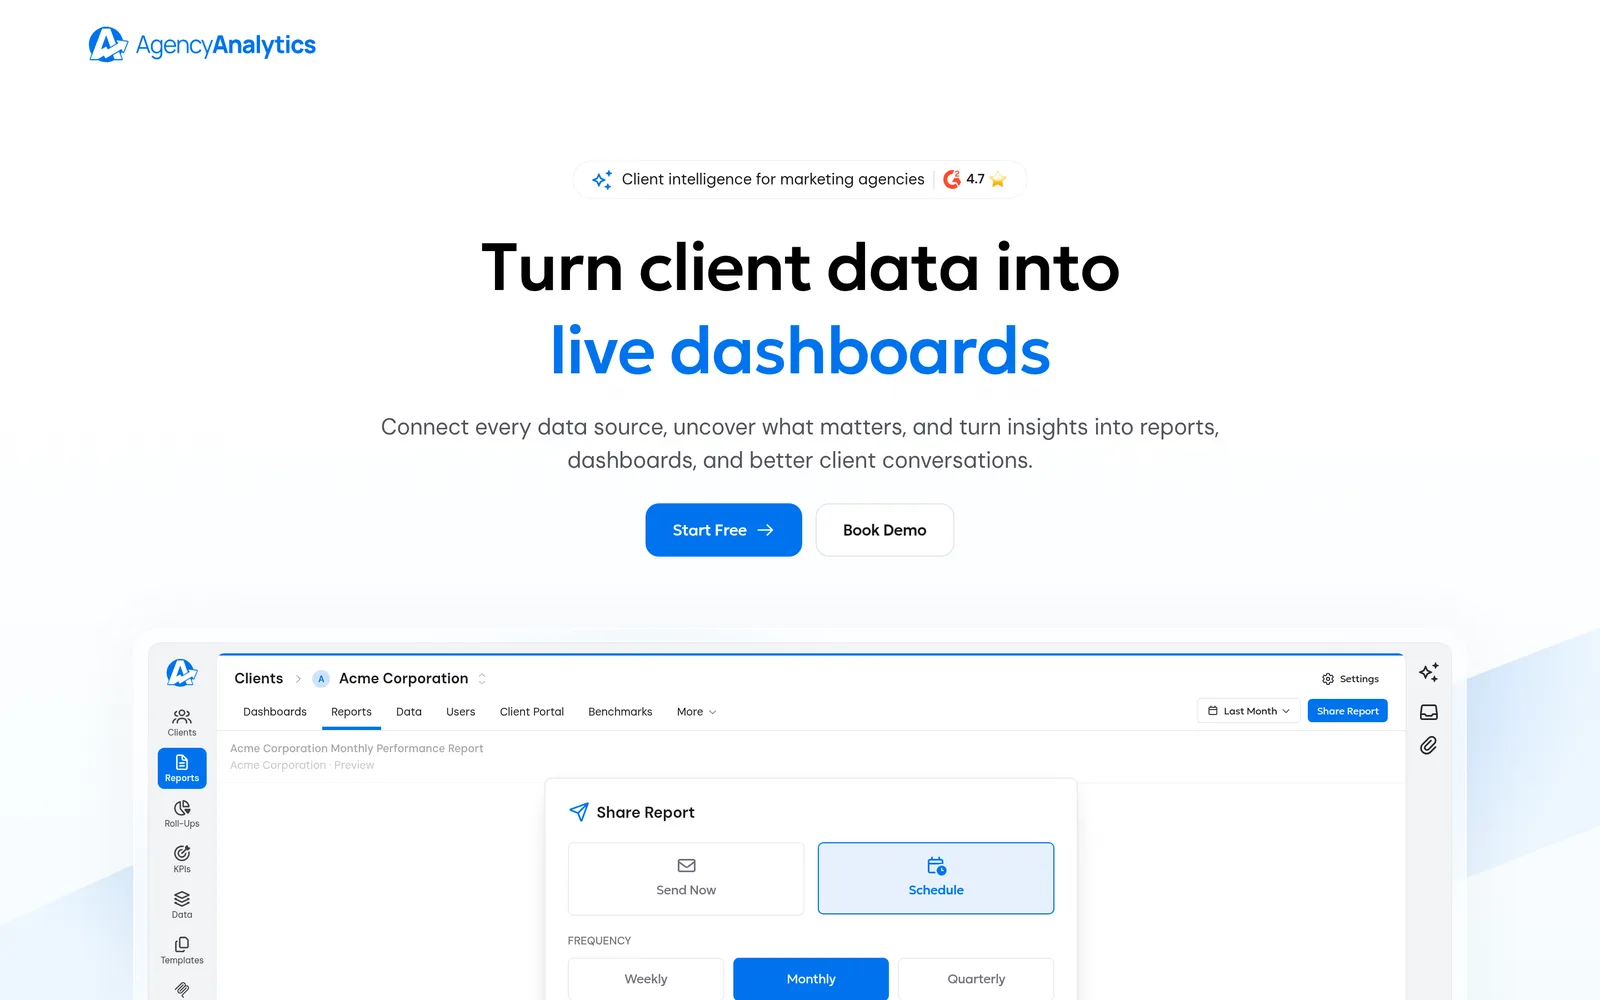
AgencyAnalytics charges per client, with unlimited data sources, reports, dashboards and staff accounts on every client. It costs $20 per client per month billed annually, includes 90+ marketing integrations, a white-labeled client portal, goals, alerts and anomaly detection, and offers volume pricing above 25 clients (AgencyAnalytics pricing).
It is built for agencies, but in-house teams that run several brands or regions can treat each one as a client.
Where it beats Data Studio: Ad, SEO and social connectors are included, so there is no separate connector bill, and reports look branded out of the box.
Where it falls short: It is a reporting tool, not a BI tool. There is no data model for joining CRM, revenue and product data the way Power BI or Looker can.
8. DashThis: best for fast, simple marketing reports without a data team
| Best for | Fast, simple marketing reports without a data team |
| Entry price | $44 a month billed yearly (Individual: 3 dashboards, 15 sources) |
| People who only view reports | Unlimited users |
| Data Studio limit it fixes | Paid connectors, setup time |
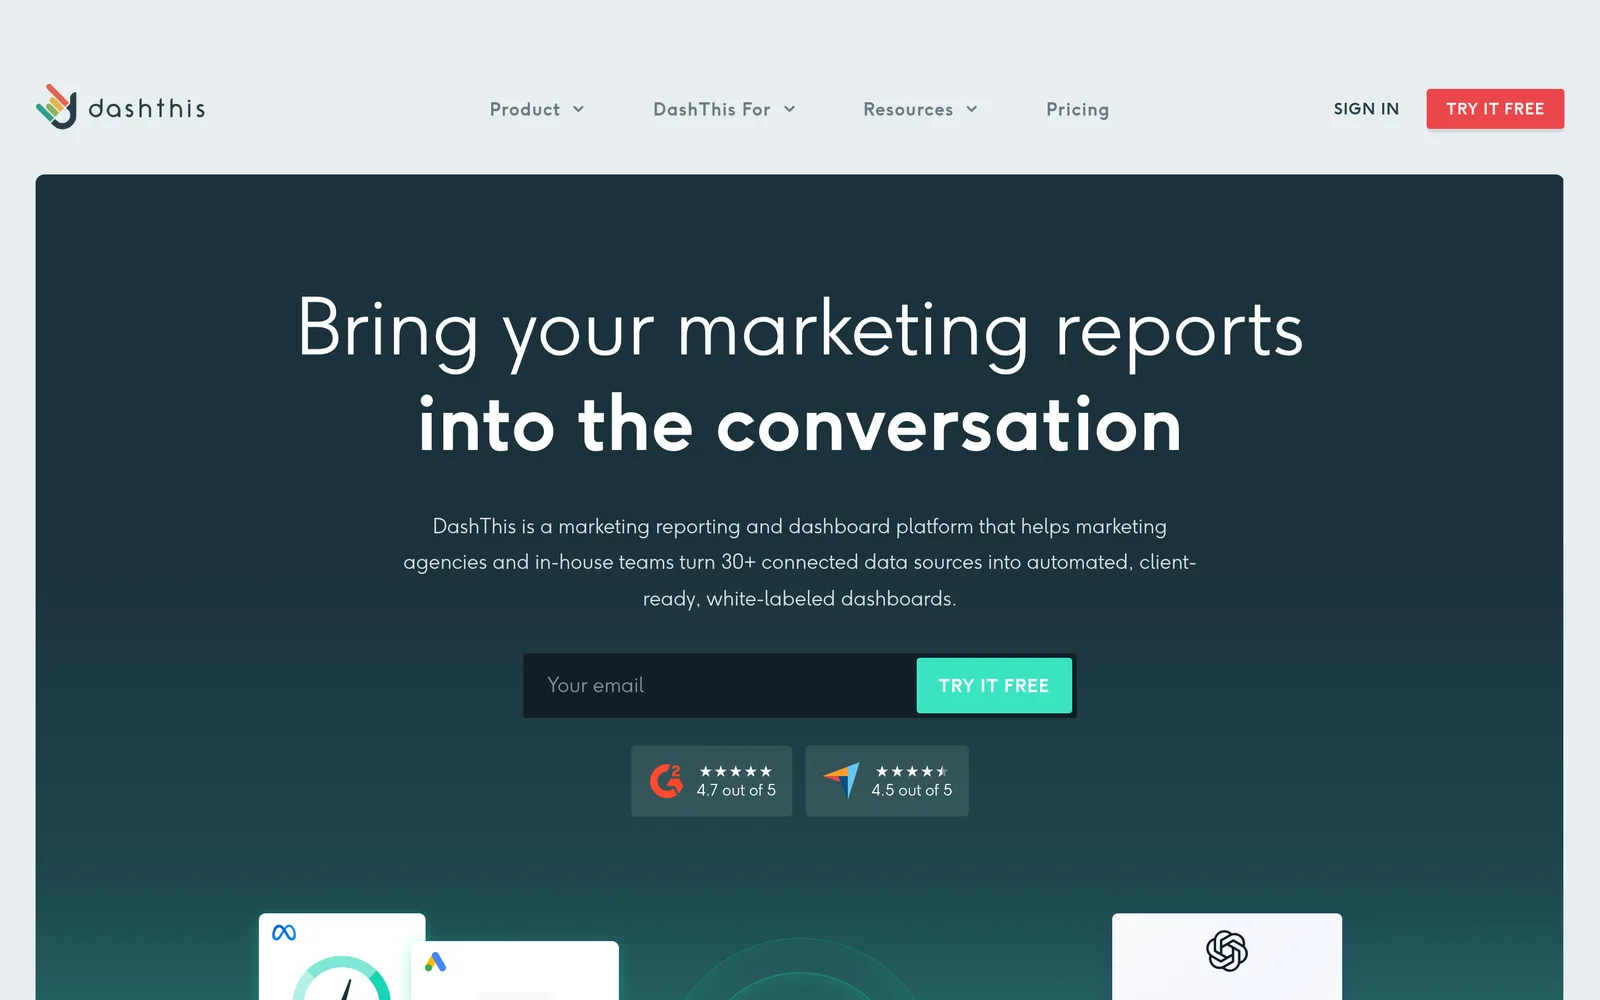
DashThis turns 30+ connected marketing data sources into automated dashboards (DashThis). Plans are priced by dashboards and sources together: Individual costs $44 a month billed yearly for 3 dashboards and 15 sources, and Professional $139 for 10 dashboards and 40 sources. Users are unlimited, and AI Insights Pro is an add-on at $19 a month ($15 billed yearly) (DashThis pricing).
Where it beats Data Studio: Reports are live in minutes from templates, with no blending or connector setup.
Where it falls short: A short connector list compared with Data Studio, and source caps that can push you up a tier.
Which Looker Studio alternative should you pick?
- Pick Data Studio Pro if your only problems are ownership, sharing, schedules or support. It is the cheapest fix at $9 per builder.
- Pick Power BI if your company already runs on Microsoft 365 and you want a data model at $14 per user.
- Pick Tableau if you have analysts doing exploratory work and budget for $75 per Creator.
- Pick Looker if your data lives in BigQuery or another warehouse and you need one governed definition of every metric.
- Pick Metabase if your data is already in a database and you want open source, or a cloud plan from $100 a month.
- Pick Klipfolio if many people view reports and you want a flat price with unlimited users.
- Pick Databox for KPI tracking with a free plan to start.
- Pick AgencyAnalytics or DashThis if you report on marketing channels for clients or brands and want connectors included.
Migration checklist: moving reports off Looker Studio
- List what each report does. Note its data sources, blends, calculated fields, filters and who views it. Retire reports nobody opens.
- Fix the data layer first. If the real problem is GA4 quotas or blends, exporting GA4 to BigQuery or loading data through a pipeline may solve it whichever tool you choose.
- Rebuild calculated fields as shared metrics. In Power BI, Looker or Metabase, define them once in the model rather than per chart.
- Run both tools side by side for one reporting cycle and check that totals match before you switch people over.
- Count viewers, not just builders, before you sign. Viewer licensing is the biggest cost difference between these tools.
- Keep Data Studio for ad hoc work. It stays free, so there is no reason to delete working reports.
How we compared these tools
We read each vendor’s pricing page on November 3, 2026, plus Tableau’s online store for per-role prices, and captured each homepage the same day. Data Studio limits come from Google’s Data Studio documentation and the GA4 Data API quota page. Costs use one scenario, 3 report builders and 12 viewers, at list price with no add-ons or discounts.
Frequently asked questions
Is Looker Studio being discontinued?
No. Google renamed Looker Studio to Data Studio on April 16, 2026. The product, your reports and the free tier continue, and the paid tier is now called Data Studio Pro.
What is the best free alternative to Looker Studio?
Metabase’s open-source edition is the strongest free option if your data is in a database, because you can self-host it at no licence cost. Databox also has a free plan with 1 user and 3 data sources. Power BI Desktop is free for building reports, but sharing them needs a Pro licence.
Is Power BI better than Looker Studio?
For teams that need to join many sources and reuse a data model, yes. Power BI has a real data model and costs $14 per user a month for Pro. Looker Studio, now Data Studio, is free and easier for quick reports on Google data, but blends stop at five tables.
What is the difference between Looker and Looker Studio?
Looker is Google’s enterprise BI platform, built on the LookML semantic layer and sold by quote with an annual contract. Looker Studio, now called Data Studio, is the free drag-and-drop reporting tool. They are separate products, though Data Studio can read Looker models.
How much does Data Studio Pro cost?
Data Studio Pro costs $9 per user per project a month on a self-service subscription. Only people who create or manage content in Pro workspaces need a licence; people who only view reports do not.
Why do my Looker Studio GA4 reports show quota errors?
Data Studio charts that read GA4 use the GA4 Data API, which limits a standard property to 40,000 core tokens per hour, 200,000 per day and 10 concurrent requests. Busy dashboards with many charts can exceed that. Fewer charts, extracted data or a BigQuery export reduce the load.
How many data sources can you blend in Looker Studio?
Up to five. A blend can join data from up to five data sources, and blends are stored inside the report where you create them, so you cannot reuse one blend across reports.