
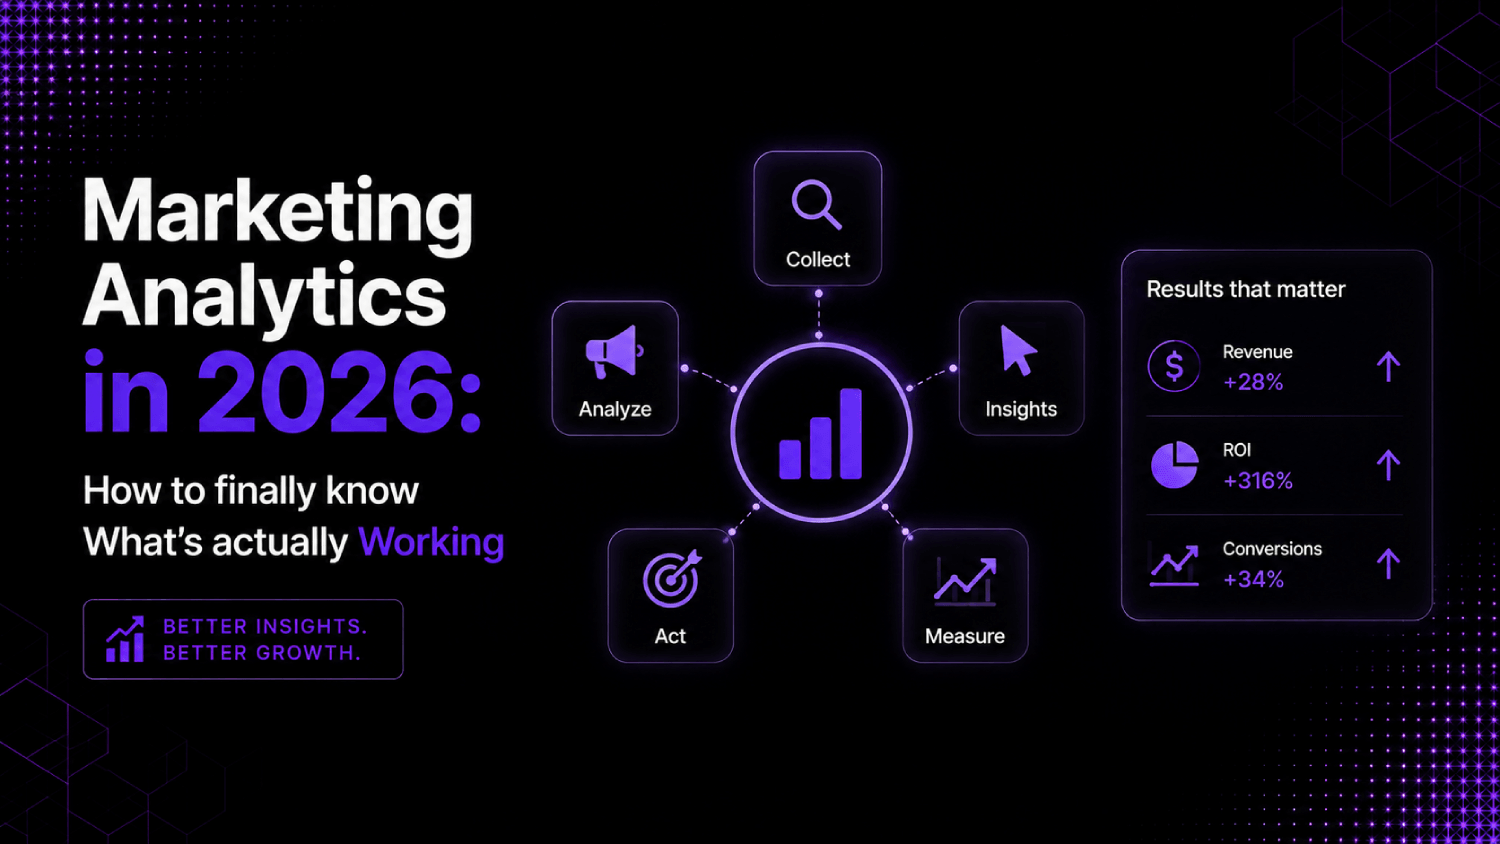
- Marketing analytics is not one tool. It is three distinct disciplines: attribution, product analytics, and marketing mix modeling, each requiring different data, different tooling, and different expertise.
- GA4 measures web traffic. It does not tell you which channel drove the revenue, why users churned, or how offline spend contributed to pipeline. Conflating the two is the most common and most expensive mistake in the space.
- The right measurement stack for a 30-person growth team looks nothing like the right stack for a 300-person revenue org. Tool selection without first mapping your data maturity wastes both budget and analyst time.
- Multi-touch attribution models assign credit. Marketing mix models estimate incremental contribution. Both are useful. Neither is sufficient alone, and most teams only use one.
- Cookie deprecation did not kill measurement. It shifted the advantage to teams who built first-party data infrastructure early. That gap is now visible in the numbers.
Marketing analytics covers the full set of methods and tools used to measure how marketing spend converts to revenue, from multi-touch attribution and product behavior tracking to statistical modeling of offline and online channels together. Done well, it answers not just what happened but what caused it and what to spend next. GA4 dashboards answer neither of those questions reliably.
Why Most Marketing Teams Are Measuring the Wrong Things
A common measurement setup looks like this: Google Analytics 4 for web traffic, a CRM report for pipeline, and a spreadsheet someone built three years ago to “tie it all together.” It does not work, and the people running it usually know it. The problem is not effort. It is that these three tools measure three different things and were never designed to connect.
GA4 tracks sessions, events, and conversions at the browser level. Your CRM tracks deals, accounts, and activities at the person and company level. The spreadsheet is someone’s best guess at connecting them. What is missing is an identity layer, an attribution layer, and in many cases any sense of what incremental impact a given channel actually had.
The result is a measurement environment where paid search gets credit for every last-click conversion it touches, brand gets credit for nothing, and the CEO asks every quarter whether content is “actually doing anything.” The frustration is rational. The data genuinely does not answer the question.
What Is Marketing Analytics, Really?
Marketing analytics is the practice of connecting marketing inputs to business outcomes using data. That definition sounds obvious, but the implementation splits into three distinct disciplines that most teams treat as one.
Attribution
Attribution assigns credit for a conversion across the marketing touchpoints that preceded it. A user saw a LinkedIn ad, then clicked a Google search ad, then opened a nurture email, then booked a demo. Attribution modeling decides which of those touchpoints gets how much credit for the closed deal. The models range from simple (last-touch, first-touch) to probabilistic (data-driven, Shapley value). Each model tells a different story from the same data, which is why choosing one without understanding its assumptions produces misleading reports.
Product Analytics
Product analytics tracks what users do inside your product after acquisition. Tools like Mixpanel, Amplitude, and Heap instrument every event, funnel, and retention cohort at the user level. For SaaS companies, this layer is often more predictive of revenue than any top-of-funnel metric. A campaign that drives trial signups that activate poorly is not a good campaign, but you will never see that in a GA4 report.
Marketing Mix Modeling
Marketing mix modeling (MMM) uses statistical regression to estimate the incremental contribution of each channel to revenue, without relying on user-level tracking at all. It works on aggregated data: weekly spend, impressions, and revenue by channel over time. That makes it privacy-safe by design, and it is the only method that can properly account for offline channels, long-lag brand effects, and cross-channel interactions. It is also the slowest to set up and the hardest to interpret without a data science background.
Most marketing teams operate in only one of these three disciplines. The teams that actually answer “what is working” operate in all three, using each for the questions it was designed to answer.
The Three-Layer Measurement Stack: An AboutMartech Framework
Choosing the right tools starts with understanding which layer of measurement you actually need. The AboutMartech Three-Layer Measurement Stack maps each discipline to its data source, its native tooling, and the specific question it answers.
| Layer | Discipline | Primary Data Source | Question It Answers | Representative Tools |
|---|---|---|---|---|
| Layer 1 | Attribution | Ad platform events, CRM, web tracking | Which touchpoints drove this conversion? | Rockerbox, Northbeam, Triple Whale, Ruler Analytics |
| Layer 2 | Product Analytics | Event streams, session data, user properties | What do acquired users actually do in the product? | Mixpanel, Amplitude, Heap, PostHog |
| Layer 3 | Marketing Mix Modeling | Aggregated spend, revenue, and impression data | What is the true incremental contribution of each channel? | Meridian (Google), Robyn (Meta), Recast, Measured |
A team at Layer 1 only is optimizing channel mix based on attributed conversions, which over-credits direct-response channels and under-credits brand. A team at Layer 3 only has a channel portfolio view but no visibility into the individual touchpoint sequences that feed it. Mature measurement programs run all three in parallel and triangulate across them when the answers diverge, which they often do.
How Does Marketing Attribution Work?
Attribution is the layer most teams engage first, and the one most misunderstood. The short version: attribution tools sit between your ad platforms, your website, and your CRM. They stitch together a path for each converted user or account, then distribute credit across touchpoints using a rule or model you define.
Rule-Based Models
Last-touch gives 100% of the credit to the final interaction before conversion. First-touch gives it all to the first interaction. Linear splits it evenly. Time-decay weights recent touches more heavily. These are fast to set up and easy to explain to a CFO, but they encode assumptions about buyer behavior that are rarely true. Last-touch in particular systematically advantages whatever channel a buyer visits right before filling out a form, which is usually branded paid search or direct, regardless of what actually drove them there.
Data-Driven Attribution
Data-driven attribution uses your own historical conversion data to estimate the actual contribution of each touchpoint pattern. Google’s data-driven model inside GA4 is the most common version teams encounter, but it is a black box: you cannot export the model weights, and it only credits touchpoints Google can observe, which excludes email, offline interactions, and anything not tagged with a Google pixel.
Independent attribution platforms like Rockerbox, Northbeam, and Ruler Analytics pull data from all your channels, including Bing, LinkedIn, Meta, email, and CRM activities, and run attribution models across the full picture. That cross-channel view is what separates real attribution from platform-reported ROAS, which every ad platform inflates by counting only its own touchpoints.
For B2B teams with long sales cycles and multiple stakeholders per account, the attribution question gets even harder. A deal that took nine months involved twenty-two touchpoints and three different buyers from the same company. Standard user-level attribution breaks down entirely. B2B attribution tools built for long sales cycles handle account-level stitching, offline events, and CRM integration in ways that consumer-focused platforms do not.
The Model-Selection Problem
There is no universally correct attribution model. Each one encodes a different theory of how buyers make decisions. The right model for a DTC brand with a 48-hour purchase window is not the right model for an enterprise SaaS company with a six-month sales cycle. Before choosing a model, write down your actual belief about how buyers in your market make decisions, then pick the model that best reflects that belief. Switching models later without documenting the change is how marketing reports become internally inconsistent over time.
For a deeper look at the tradeoffs between common attribution approaches, the comparison of multi-touch vs last-touch attribution models covers exactly where each one breaks down.
What Role Does a CDP Play in Marketing Analytics?
A customer data platform (CDP) is the identity layer that makes coherent attribution possible. It resolves anonymous browser sessions to known users, stitches together cross-device paths, and creates unified customer profiles that attribution tools, product analytics tools, and marketing platforms can all read from the same source of truth.
Without identity resolution, your attribution tool sees the same buyer as four different people: the anonymous Google ad clicker, the email recipient, the signed-in trial user, and the CRM contact. Credit gets split incorrectly. Conversion rates look wrong. Cohort analyses are unreliable.
CDPs handle this through deterministic matching (matching on known identifiers like email or phone number) and probabilistic matching (inferring identity from device signals, IP, and behavioral patterns). Deterministic matching is more accurate. Probabilistic matching extends coverage to users who never shared an identifier. Most enterprise CDPs use both. For teams evaluating which approach fits their data infrastructure, the roundup of best CDPs for B2B teams covers the major platforms in detail, including how each handles identity resolution across anonymous and known profiles.
Warehouse-native CDPs are worth calling out separately. Platforms like Hightouch, Census, and dbt-adjacent architectures keep customer data in your own data warehouse (Snowflake, BigQuery, or Databricks) rather than in a vendor’s proprietary store. That matters for analytics teams that want to run their own SQL queries on the unified profile, rather than being limited to whatever the CDP vendor exposes in their UI.
How Does Marketing Mix Modeling Fit In?
Marketing mix modeling is the oldest form of marketing measurement and, in 2026, one of the most relevant again. The reason: MMM does not need user-level data. It works on aggregate inputs and outputs, which means cookie deprecation, iOS privacy changes, and ad platform walled gardens do not affect it the way they affect attribution tools.
The basic mechanics: you feed a regression model weekly data on ad spend by channel, impressions, pricing, seasonality, and revenue or pipeline. The model estimates the coefficients for each channel, effectively answering “if we increased spend in this channel by $100K, how much additional revenue would we expect?” Those coefficients become the basis for budget allocation decisions.
The limitation is time. MMM needs 18 to 24 months of historical data to produce reliable coefficients, and model runs take time to set up correctly. It is not a tool for weekly optimization. It is a tool for quarterly budget planning. Teams that treat it as a real-time reporting solution will be disappointed.
Meridian, Google’s open-source Bayesian MMM framework, and Robyn, Meta’s open-source alternative, have brought the methodology to teams that cannot afford enterprise vendors. Commercial platforms like Recast and Measured package the methodology with managed services and pre-built connectors, which is worth the cost for teams without an in-house data scientist. The full range of platforms is covered in the roundup of best marketing mix modeling tools for post-cookie measurement.
Which Marketing Analytics Tools Do You Actually Need?
The honest answer depends on your company’s revenue stage and data infrastructure, not on a vendor’s feature checklist. Here is how the tool selection actually maps to org size and maturity.
Seed to Series A (Under $5M ARR)
At this stage, the right analytics stack is usually GA4 plus your CRM’s native reporting plus one product analytics tool. Mixpanel’s free tier handles most event tracking needs up to a meaningful scale. Adding a full attribution platform before you have enough conversion volume to train a data-driven model is premature. Focus on getting clean event tracking in place, because bad data upstream makes every downstream tool less useful, not more.
Series B to Series C ($5M to $50M ARR)
This is where attribution platforms become worth the investment. You have enough conversion volume to see meaningful signal, multiple channels running simultaneously, and finance starting to ask harder questions about CAC payback by channel. A dedicated attribution tool like Ruler Analytics (strong on CRM integration) or Rockerbox (strong on DTC and ecommerce) starts earning its cost. A warehouse destination (Snowflake or BigQuery) becomes important here too, so that your analytics is not locked inside individual tool UIs.
Series D and Beyond ($50M+ ARR)
At this scale, you are running all three layers. Attribution for channel-level optimization. Product analytics for retention and expansion revenue signals. MMM for portfolio-level budget allocation. You probably also have a CDP in the stack for identity resolution, and a reverse ETL layer to push enriched segments back into your activation tools. The data team owns the warehouse. Marketing ops owns the tooling layer above it. If those two teams are not aligned, the analytics investment produces reports that neither side trusts.
What Is the Biggest Gap in Most Marketing Measurement Programs?
The gap is almost always the same: teams measure acquisition obsessively and measure post-acquisition behavior almost not at all. CAC gets tracked to the decimal. What happens after the signup or the closed deal is often a black box.
This matters for revenue, not just product metrics. A campaign that drives high-volume trial signups with a 4% activation rate is destroying value, not creating it. The sales-qualified leads generated by one content cluster might convert to closed-won at 2x the rate of another, but if the attribution tool only tracks MQL volume, the lower-converting cluster looks equivalent or even better.
Consider a hypothetical SaaS team running paid social and SEO in parallel. Paid social drives 400 MQLs per month at $120 CAC. SEO drives 150 MQLs at $40 CAC. At the MQL level, paid social wins on volume and SEO wins on cost. But if the SEO cohort converts to paid customer at 18% and the paid social cohort converts at 6%, the actual revenue math reverses entirely. Without connecting the attribution layer to the CRM outcome data, the team continues over-investing in paid social because the dashboard says so. This kind of MQL-to-SQL leakage is invisible without a unified data model that follows leads through the full funnel to closed revenue.
Connecting the acquisition layer to the post-acquisition layer requires either a CDP that can stitch both, or a warehouse-based model that joins ad platform data, CRM data, and product event data in a single schema. Neither is trivial to build. Both pay off quickly once in place.
How Does Cookie Deprecation Change Marketing Measurement?
Third-party cookie deprecation has already materially affected attribution accuracy for teams that did not adapt. Safari’s Intelligent Tracking Prevention has been blocking third-party cookies since 2017. Firefox followed. Chrome’s deprecation timeline has shifted repeatedly, but the direction has not changed.
The practical impact: user paths that cross domains, devices, or ad platform walled gardens become harder to stitch together without first-party identifiers. Last-click conversion windows in Meta and Google ad platforms shrink as attribution windows narrow to match what their pixels can observe. GA4 sessions undercount in privacy-focused browsers. Models trained on historical click data become less reliable as the tracking foundation degrades.
The teams that adapted earliest did two things: they built first-party data collection aggressively (email capture, logged-in experiences, loyalty programs), and they shifted some measurement weight from click-based attribution to MMM and incrementality testing. The guide on measuring marketing ROI without third-party cookies walks through the specific technical alternatives in detail, including server-side tagging, conversion APIs, and clean room partnerships.
How to Build a Marketing Analytics Dashboard That People Actually Use
Most marketing dashboards fail for one of two reasons: they report on too many metrics, or they report on metrics that no one can act on. A dashboard that shows 47 metrics is a reporting artifact, not a decision tool.
The right dashboard structure separates three kinds of metrics. Leading indicators (MQLs, activated trials, pipeline created this week) tell you what is likely to happen. Lagging indicators (closed revenue, CAC, payback period) tell you what already happened. Diagnostic metrics (MQL-to-SQL conversion rate, campaign-level CPL, email deliverability) tell you why the leading indicators are moving the way they are. Most dashboards show only lagging indicators, which means by the time the number is wrong, it is too late to fix it.
Dashboard tooling matters less than the underlying data model. A well-structured Looker Studio report pulling from a clean BigQuery schema will outperform an expensive BI tool sitting on top of messy, unjoined event tables. The roundup of best marketing dashboard tools for eliminating manual reporting covers the major options across self-serve and analyst-grade tiers.
Frequently Asked Questions
What is marketing analytics?
Marketing analytics is the practice of measuring and analyzing marketing activities to understand their effect on business outcomes like revenue, pipeline, and customer retention. It spans web analytics, multi-touch attribution, product behavior tracking, and statistical methods like marketing mix modeling. The goal is not to produce reports but to support decisions: which channels to fund, which campaigns to cut, and where the conversion funnel breaks down.
How is marketing attribution different from marketing analytics?
Attribution is one discipline within the broader field of marketing analytics. Specifically, attribution answers the question of which marketing touchpoints deserve credit for a conversion. Marketing analytics is the larger practice that includes attribution but also covers product analytics, funnel analysis, cohort analysis, revenue forecasting, and marketing mix modeling. Conflating the two leads teams to over-index on attribution tooling while ignoring the other measurement layers that answer equally important questions.
What is the best marketing analytics tool?
There is no single best tool because the disciplines require different tools. For web analytics, GA4 is the default, though teams frustrated with its interface have strong alternatives. For attribution, Rockerbox and Northbeam lead for ecommerce and DTC; Ruler Analytics and Attribution are stronger for B2B. For product analytics, Mixpanel and Amplitude dominate, with PostHog as a strong open-source option. For MMM, Recast and Measured offer managed approaches, while Meridian and Robyn are viable open-source frameworks for teams with data scientists.
How does multi-touch attribution work?
Multi-touch attribution distributes conversion credit across all the marketing touchpoints a buyer interacted with before converting, rather than assigning all credit to one touch. Rule-based versions (linear, time-decay, U-shaped) use fixed formulas to split credit. Data-driven versions use your historical data to estimate which touchpoint patterns actually correlate with conversion. The model you choose encodes assumptions about buyer behavior, which is why the same conversion data produces different channel rankings depending on which model you apply.
What is marketing mix modeling and when should I use it?
Marketing mix modeling (MMM) is a statistical method that estimates the incremental revenue contribution of each marketing channel using aggregated spend and outcome data over time, without relying on user-level tracking. It is appropriate when you have significant offline spend, when walled gardens and cookie limitations make user-level attribution unreliable, or when you need to model the long-term brand effects that click-based attribution cannot capture. It requires at least 18 months of historical data and works best as a quarterly planning tool rather than a real-time optimization instrument.
Can I do marketing analytics without a data warehouse?
Yes, but the ceiling is low. Tool-native analytics (reports inside HubSpot, Salesforce, or your ad platforms) are fast to access but siloed by definition. They cannot show you cross-channel attribution, full-funnel conversion rates, or revenue by acquisition cohort without manual stitching. A data warehouse (Snowflake, BigQuery, Redshift) becomes necessary once you want to join data from more than two systems, run custom cohort models, or produce analytics that finance and leadership will hold you accountable to over time.
How do I measure marketing ROI accurately?
Accurate marketing ROI requires three things: a clean definition of what counts as revenue or pipeline, a consistent methodology for attributing that revenue back to marketing inputs, and a data infrastructure that connects your ad platforms, website, CRM, and product in one place. Most ROI calculations break at the second step, using platform-reported conversions that double-count and over-credit the platforms doing the reporting. Running a holdout test or an incrementality experiment against a control group is the most reliable way to validate whether your attribution model reflects reality.
What is the difference between a CDP and a marketing analytics platform?
A CDP is an identity and data infrastructure tool: it resolves user identities, unifies profiles across touchpoints, and makes that data available to other systems. A marketing analytics platform uses data to answer measurement questions about campaign performance and channel contribution. CDPs feed analytics platforms by providing cleaner, more complete identity graphs. Without a CDP, attribution tools and product analytics tools often work from fragmented, unstitched user data, which degrades the accuracy of every report they produce.
The Measurement Maturity Gap Is a Competitive Advantage
Most companies are not losing to competitors with better creative or better products. They are losing to competitors who know which channels are actually working and can shift budget faster. That gap is a measurement gap, and it compounds over time. A team that builds a clean three-layer measurement stack in year one has two years of better data for training models, running incrementality tests, and making budget calls that finance trusts. A team still on a GA4 dashboard and a spreadsheet is two years behind and falling further behind every quarter.
The path forward is not buying more tools. It is understanding which questions your current tools cannot answer, then acquiring only the capability that closes that specific gap. Attribution before you have first-party data infrastructure is noise. MMM before you have 18 months of clean spend data is guesswork. Product analytics before you have instrumented your product events is a fancy way to count pageviews. The sequence matters as much as the selection.
The teams that get this right treat measurement as a product, not a project. They have a data model, a tool owner, a review cadence, and a documented set of questions the analytics stack is supposed to answer. Everything else is just dashboards nobody reads.