- Mixpanel and Amplitude are not interchangeable. They diverge meaningfully on pricing structure, query depth, and the technical lift required to get value fast.
- Mixpanel’s free tier covers up to 20 million monthly events with no seat restrictions, making it the lower-risk starting point for early-stage teams.
- Amplitude’s analytics engine goes deeper on behavioral cohorts, predictive modeling, and session replay, but that depth costs more and takes longer to configure.
- Most teams under 50 people will get more value out of Mixpanel sooner. Amplitude earns its price at scale, particularly for product teams running structured experimentation programs.
- The right call depends on three things: current event volume, whether you need experimentation infrastructure, and how much analyst time you can dedicate to setup.
Mixpanel is the better default for lean teams that need fast, self-serve funnel and retention analysis on a predictable budget. Amplitude is the stronger choice for mid-market and enterprise product organizations that need behavioral cohorts, built-in A/B testing infrastructure, and predictive analytics, and have the engineering and analyst resources to configure them. Both tools track user behavior in products, but they are not the same tool at different price points. They reflect different philosophies about who should do the analysis and how deep it should go.
Why Most Mixpanel vs Amplitude Comparisons Get It Wrong
The standard take is that Amplitude has more features and Mixpanel is simpler and cheaper. That framing misses the point. Amplitude’s additional surface area is not always an asset. For a growth team of four people trying to understand why free-to-paid conversion dropped last month, a session replay module and a predictive churn score are noise, not signal.
What actually separates these two tools is the implied team profile they were built for. Mixpanel was designed so that a product manager with no SQL experience can answer most questions without filing a data request. Amplitude was designed so that a data science team can build durable behavioral models and run governed experiments at scale. Neither framing is a knock on the other. They are just different products.
The mistake most buyers make is evaluating features without first establishing what analysis they need to run in the next 90 days and who will run it. This article is built around that decision, not a feature checklist.
How Does Mixpanel Pricing Actually Work in 2025?
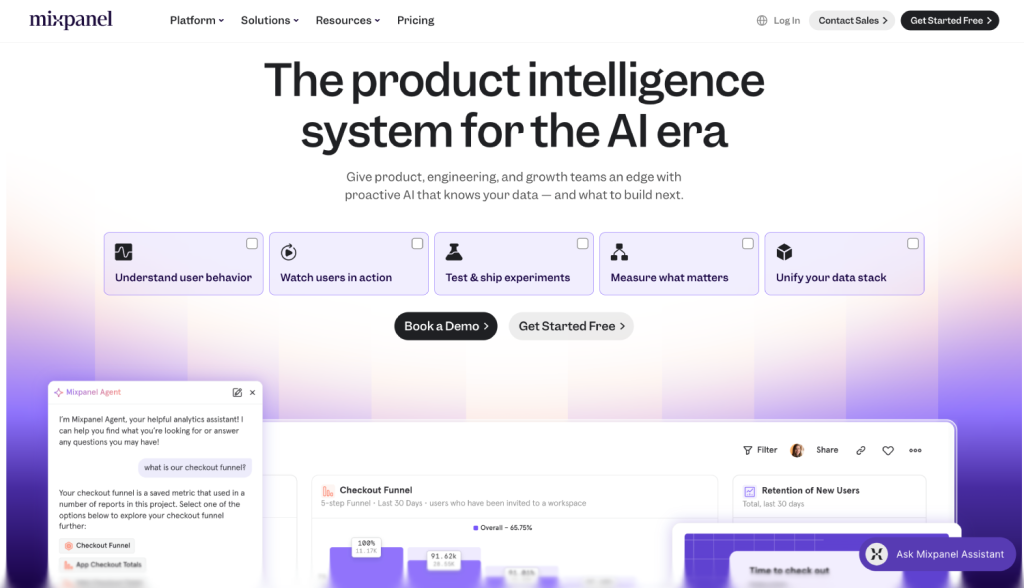
Mixpanel publishes its pricing openly. According to Mixpanel’s public pricing page, the Free plan covers up to 20 million monthly tracked events with unlimited user seats and 90 days of data history. That is a genuinely generous free tier, particularly for teams in early product-market-fit stages.
The Growth plan starts at $28 per month for up to 100 million events when billed annually. Data history extends to 12 months on Growth and to 36 months on the Enterprise tier. Enterprise pricing is quote-based and adds features like SSO, custom data governance controls, and dedicated support.
One structural advantage worth noting: Mixpanel’s pricing is event-based, not seat-based. The whole marketing and product org can access reports without adding per-user costs. For companies that want broad internal access to product data, that model is materially cheaper than per-seat alternatives.
How Does Amplitude Pricing Actually Work in 2025?
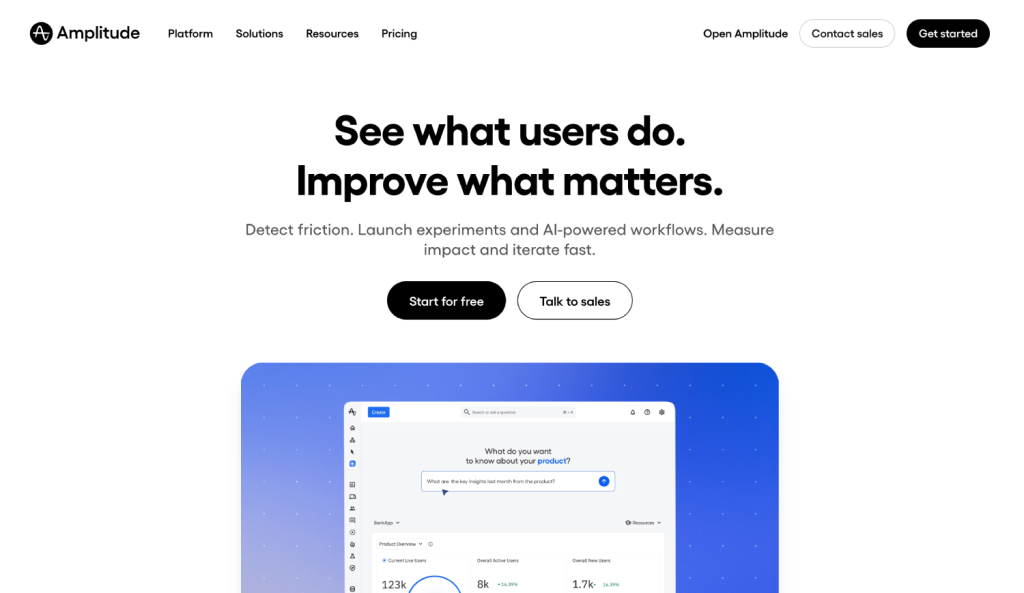
Amplitude also publishes tiered pricing. According to Amplitude’s public pricing page, the Starter plan is free and covers up to 50,000 monthly active users with a single analytics chart type and limited features. The Plus plan is listed at $61 per month billed annually and adds funnel analysis, retention charts, and more query types.
Growth and Enterprise tiers are quote-based and give access to session replay, behavioral cohorts, experimentation (A/B testing), and advanced predictive analytics. Amplitude measures usage by monthly active users (MAUs) rather than raw events, which creates a different cost curve. A product with high user counts but moderate event depth can run expensive fast on Amplitude in a way it would not on Mixpanel.
Amplitude’s free tier is more restrictive than Mixpanel’s in practice. The 50,000 MAU limit sounds generous but the feature set on the free plan is thin enough that most product teams will need to move to a paid tier quickly to do meaningful retention or funnel analysis.
Mixpanel vs Amplitude Pricing: Side-by-Side
| Plan | Mixpanel | Amplitude |
|---|---|---|
| Free tier | Up to 20M events/month, unlimited seats, 90-day history | Up to 50K MAUs, limited chart types |
| Entry paid | $28/month (100M events, annual billing) | $61/month (Plus plan, annual billing) |
| Mid-tier | Usage-based, scales with events | Quote-based Growth plan |
| Enterprise | Quote-based | Quote-based |
| Pricing unit | Events | Monthly active users (MAUs) |
| Seat costs | None | Varies by plan |
| Session replay | Add-on (Growth+) | Growth and Enterprise only |
Which Tool Has Stronger Analytics Depth?
Amplitude wins on raw analytical horsepower, and it is not close at the enterprise tier. Behavioral cohorts in Amplitude can be built using complex sequences of events across arbitrary time windows, then used to trigger downstream workflows or feed into predictive models. Amplitude’s Compass feature identifies the early behaviors most correlated with retention. That kind of predictive behavioral analysis does not exist natively in Mixpanel.
Mixpanel’s core analytics, funnels, retention curves, flows, and user-level event streams, are excellent and cover the majority of what most product teams actually need. The query interface is faster to learn and faster to operate day-to-day. A product manager can build a funnel report in Mixpanel in under three minutes without training. The equivalent in Amplitude’s more powerful cohort builder can take considerably longer for someone new to the product.
Amplitude also includes a native experimentation module (Amplitude Experiment) for teams running structured A/B tests. Mixpanel has no equivalent. Teams that need experimentation infrastructure have to pair Mixpanel with a dedicated tool like LaunchDarkly or Statsig, which adds integration overhead but also adds flexibility.
What Does the Learning Curve Actually Look Like?
This is where the philosophical difference between the two products becomes concrete. Mixpanel was designed with the assumption that the person asking the question is the person building the report. The interface is optimized for that workflow. Amplitude was designed with the assumption that a data team will define the event taxonomy and build the foundational reports, and then a broader team will use those reports.
That distinction has real operational implications. A startup that instruments Mixpanel on a Friday can have meaningful retention charts by Monday with no analyst involvement. The same team adding Amplitude will likely need a structured implementation sprint, including defining the user taxonomy, setting up behavioral properties correctly, and configuring the chart library for the use cases they care about.
For teams building out a broader data infrastructure, that structured approach is a feature, not a bug. Poorly governed event taxonomies produce garbage analytics regardless of which tool you use. Amplitude’s implementation friction forces discipline. But for a ten-person SaaS team that needs answers now, the friction is just friction.
How Do Mixpanel and Amplitude Handle Data Infrastructure?
Both tools accept data via direct SDK instrumentation, server-side APIs, and third-party connectors. Mixpanel integrates natively with Segment, RudderStack, and most major Segment alternatives. Amplitude does too, and also offers a deeper warehouse-native data connection for teams that want to sync behavioral data directly from Snowflake, BigQuery, or Databricks without routing through a CDP.
Amplitude’s warehouse connector is a genuine differentiator for data-mature organizations. If your canonical user data lives in a warehouse and you want Amplitude to enrich that with behavioral signals rather than the reverse, the integration is cleaner than what Mixpanel offers. For teams building toward a warehouse-first analytics architecture, that matters. If your team is already running reverse ETL workflows to activate warehouse data, Amplitude’s native connectors slot in more cleanly than Mixpanel’s current integration surface.
Mixpanel’s Lexicon feature provides a data dictionary and event governance layer that helps larger teams manage schema drift, which is the slow degradation that happens when engineers add events without coordination. It is a useful control plane, though Amplitude’s equivalent governance tooling at the enterprise tier is more developed.
If your team is already running a B2B customer data platform upstream of either tool, both integrate well. The question is whether you want the CDP to be the source of truth for identity resolution or whether you want the product analytics tool to handle that natively. Mixpanel resolves identity at the user level with its own ID merge logic. Amplitude does the same, but with more configuration options for complex identity graphs at scale.
The AboutMartech Stack-Fit Test for Product Analytics
Feature lists tell you what a tool can do. They do not tell you whether your team will actually use those features, or whether the implementation cost justifies the capability. This four-check framework is structured around the architectural decisions that are genuinely expensive to reverse, the ones buyers rarely ask about until they are already locked in.
Check 1: Who owns the analysis? If product managers run their own queries daily, Mixpanel’s interface advantage is worth more than Amplitude’s ceiling. If a dedicated analytics engineer or data scientist owns the modeling layer, Amplitude’s depth justifies the configuration cost. This is not about preference, it is about where analytical bottlenecks will form six months after you go live.
Check 2: What is your event volume in 12 months? Model your instrumented events, not your current volume. Teams that instrument aggressively can hit Mixpanel’s Growth tier limits faster than expected. On Amplitude’s MAU model, event density does not drive cost, user count does. Know which number grows faster for your product. A high-instrumentation product with 20,000 MAUs behaves very differently under each pricing model than a low-instrumentation product with 200,000 MAUs.
Check 3: Do you need experimentation infrastructure now? If A/B testing is a current priority and not a roadmap item, Amplitude’s built-in experimentation module removes one vendor from the stack. If experimentation is six months away, Mixpanel’s lower entry cost wins in the interim. Buying experimentation infrastructure before you have the traffic volume to run statistically valid tests is a common and costly mistake.
Check 4: What does your warehouse look like? Teams with a mature data warehouse will find Amplitude’s warehouse-native connectors more useful. Teams without warehouse infrastructure should not pay for that capability. If you are evaluating warehouse-native CDPs alongside your product analytics decision, resolve the data layer architecture first, then choose the analytics tool that fits what you actually build.
Mixpanel vs Amplitude: Which Is Better for Startups?
For startups, Mixpanel is the better default and it is not a close call below Series B. The free tier covers real usage at real scale, the interface gets a team to insights without an implementation sprint, and the event-based pricing model is easier to budget as volume grows. The absence of seat fees matters at a stage when everyone from the founder to the designer needs product data access.
Amplitude’s Starter plan is free in name but limited enough in features that most teams will be on a paid tier within weeks. The payoff for that cost, deeper behavioral modeling and experimentation, is most valuable when you have enough users and analyst bandwidth to act on those insights. Early-stage teams rarely have either.
Say a SaaS startup has 8,000 MAUs and a three-person product team. On Mixpanel’s free tier, that team gets funnel analysis, retention curves, and user-level flows at no cost. On Amplitude’s free tier, they hit the MAU limit before they have enough behavioral data to build meaningful cohorts. The math on free tier utility favors Mixpanel by a significant margin for pre-growth companies.
Mixpanel vs Amplitude: Which Is Better for Mid-Market and Enterprise Teams?
At 100,000 MAUs and above, with a data team and a structured experimentation program, Amplitude is the stronger platform. The behavioral cohort builder, predictive analytics, and Amplitude Experiment module create a closed loop between analysis and intervention that Mixpanel cannot replicate without third-party tooling. Teams running continuous experimentation need that loop to be tight.
Amplitude also integrates well with downstream customer success workflows. If your product analytics feed into a customer success platform for health scoring or expansion signals, Amplitude’s richer behavioral output gives the CS team more to work with than event counts alone.
The enterprise-tier pricing on Amplitude is quote-based and, by most accounts in the market, meaningfully more expensive than Mixpanel Enterprise at equivalent scale. Teams evaluating both at this tier should negotiate hard and pressure both vendors on data export rights and contract flexibility before committing.
Head-to-Head Feature Comparison
| Capability | Mixpanel | Amplitude |
|---|---|---|
| Funnel analysis | Strong, fast to build | Strong, more configuration options |
| Retention analysis | Strong, multiple retention models | Strong, with predictive extension |
| Behavioral cohorts | Good | Strongest for complex sequences |
| Session replay | Add-on (Growth+) | Add-on (Growth/Enterprise) |
| A/B experimentation | Not native | Native (Amplitude Experiment) |
| Predictive analytics | Not available | Available (Growth/Enterprise) |
| Warehouse-native ingestion | Limited | Stronger (Snowflake, BigQuery, Databricks) |
| Learning curve | Low to moderate | Moderate to high |
| Free tier generosity | High (20M events) | Moderate (50K MAUs, limited features) |
| Attribution overlap | Basic | Basic |
Neither tool is a replacement for a dedicated marketing attribution platform. Both track behavioral events in your product, but attributing revenue to marketing channels at the campaign level requires a separate tool with ad platform integrations and multi-touch modeling.
What Are the Real Weaknesses of Each Tool?
Mixpanel’s weakest area is the ceiling. Teams that outgrow basic funnel and retention analysis and want to run serious behavioral science, build predictive churn models, or operate experimentation programs at scale will eventually feel the constraint. The tooling was not built for that and adding third-party solutions around it creates coordination overhead.
Amplitude’s weakest area is the entry experience. The implementation complexity, the steeper learning curve, and the more restrictive free tier create a slower time-to-value. Teams that pick Amplitude before they have the internal resources to configure it properly often end up with an expensive tool they use for basic dashboards, which is a waste of budget and capability.
Both tools have limited built-in marketing attribution. If your team needs to connect product behavior to ad spend or channel performance, you are adding infrastructure either way.
Frequently Asked Questions
Is Mixpanel or Amplitude better for a B2B SaaS company?
For most B2B SaaS companies under 200 employees, Mixpanel is the more practical choice because it delivers funnel and retention analysis faster with lower implementation overhead. Amplitude becomes the better option when you have a dedicated product analytics team, a structured experimentation program, and complex behavioral segmentation requirements that exceed what Mixpanel’s cohort builder can express. At the enterprise tier, both tools are viable, and the decision often comes down to contract terms and existing data infrastructure.
Can you use Mixpanel and Amplitude together?
Technically yes, but it rarely makes sense. Running both tools simultaneously means double instrumentation, double event governance overhead, and two sources of truth for product behavior data. Some large organizations run Mixpanel for product-facing self-serve analytics while a central data team uses Amplitude for deeper modeling, but that architecture requires strict data governance to avoid contradictory metrics. For most teams, pick one and instrument it well.
How does Amplitude’s MAU pricing compare to Mixpanel’s event pricing in practice?
It depends on your product’s instrumentation density. A product that fires 200 events per user session will accumulate event volume fast on Mixpanel but will cost the same on Amplitude regardless of event count, because Amplitude charges by MAU. High-instrumentation products with moderate user counts often end up cheaper on Amplitude at scale. Low-instrumentation products with large user bases flip that math. Model your specific volume before assuming one is cheaper than the other.
Does Amplitude have better data governance than Mixpanel?
At the enterprise tier, yes. Amplitude’s Govern module provides schema enforcement, event blocking, and property transformation at the ingestion layer, which is meaningful for large teams where engineering, product, and analytics have to coordinate on event taxonomy. Mixpanel’s Lexicon provides a data dictionary and some governance controls, but the enforcement mechanisms are lighter. For a team of five, neither tool’s governance tooling will be a deciding factor. For a team of 50 with multiple product lines, Amplitude’s governance infrastructure is more mature.
Which tool is easier to migrate away from?
Mixpanel is generally easier to exit because the event-based data model is more portable. Amplitude’s behavioral cohorts and predictive models are built on top of Amplitude’s own behavioral graph, which does not export cleanly into another system. That lock-in is not unusual in analytics, but it is worth noting before committing to Amplitude’s deeper features. Both tools allow raw event data export on paid tiers, so base event data is recoverable in either case.
Do either of these tools replace Google Analytics?
No. Both Mixpanel and Amplitude are product analytics tools, meaning they track authenticated user behavior inside your product. Google Analytics 4 (and its alternatives) track anonymous web traffic from acquisition through landing pages. They answer different questions. If you are evaluating alternatives to Google Analytics 4 for web traffic and marketing measurement, you want a different category of tool entirely.
Verdict: Which Tool Should You Pick?
Pick Mixpanel if: your team is under 50 people, you need fast time-to-value, you want everyone in the organization to access product data without per-seat costs, and you do not have a dedicated analytics engineer to own the implementation. The free tier is genuinely useful, the interface gets a product manager to answers without SQL, and the event-based pricing is predictable as you grow.
Pick Amplitude if: you have a product analytics team or data science function, you are running or planning structured experimentation, your user base is large enough that MAU-based pricing is more economical than event-based pricing, or you need deep behavioral cohort modeling that feeds into downstream retention and expansion programs. Amplitude’s ceiling is higher. Getting there costs more time and money upfront.
The single most durable insight here is about implied team maturity, not features. Amplitude is not a better Mixpanel. It is a different tool built for organizations that have already extracted full value from a simpler analytics layer and need a more governed, more powerful replacement. Buying Amplitude before you reach that stage means paying enterprise prices for starter usage. Staying on Mixpanel after you outgrow it means working around limitations that a different tool would eliminate. Know where you are in that arc before you sign anything.